Google Analytics and SEMrush are essential tools to track traffic and user analytics effectively. They provide detailed insights into user behavior and website performance.
Understanding your website’s traffic and user analytics is crucial for online success. Google Analytics offers comprehensive data on visitor behavior, traffic sources, and conversion rates. SEMrush complements this by providing competitive analysis, keyword tracking, and backlink auditing. These tools help identify trends, optimize content, and enhance user experience.
Tracking metrics like bounce rate, session duration, and page views can guide strategic decisions. They empower businesses to tailor marketing strategies, improve site performance, and increase user engagement. Utilizing these tools can lead to more informed decisions, ultimately driving growth and achieving online goals.

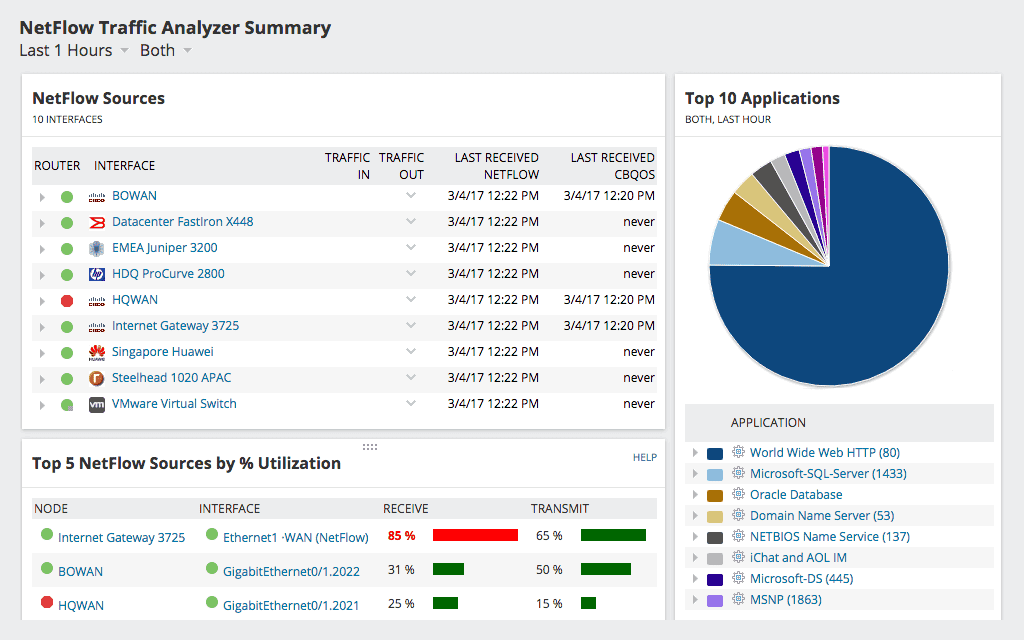
Credit: www.solarwinds.com
Google Analytics
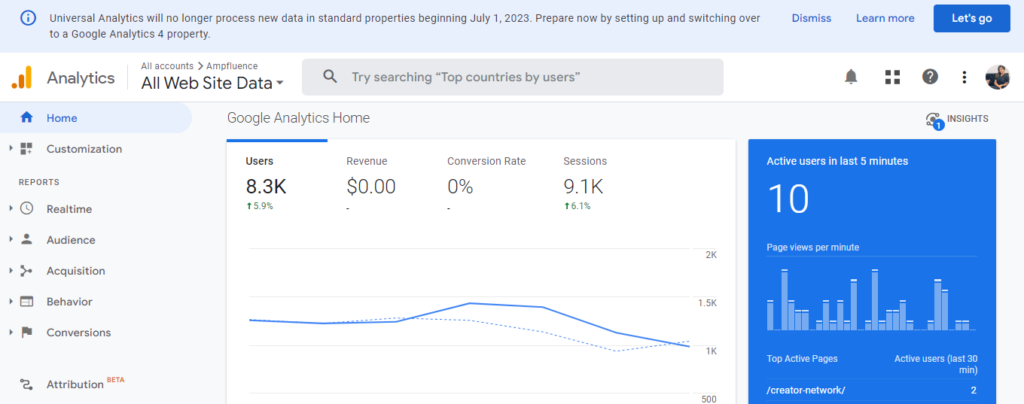
Google Analytics is an essential tool for tracking website traffic and user behavior. It provides comprehensive insights into how visitors interact with your site. This helps improve your digital marketing strategies.
Features
Google Analytics offers a wide range of features. These help track and analyze your website traffic.
- Real-Time Reporting: Monitor activities as they happen on your site.
- Audience Insights: Learn about your visitors’ demographics and interests.
- Acquisition Reports: Understand how users find your website.
- Behavior Analysis: See what users do on your site and which pages they visit.
- Conversion Tracking: Measure your goals and sales performance.
Setting Up
Setting up Google Analytics is simple and straightforward. Follow these steps to get started:
- Create a Google Analytics account.
- Add your website to the account.
- Install the tracking code on your website.
- Verify the tracking code is working.
- Start analyzing your website data.
Ensure the tracking code is added to every page of your site. This guarantees accurate data collection.
Key Metrics
Google Analytics provides key metrics that help understand user behavior.
| Metric | Description |
|---|---|
| Sessions | Number of visits to your site. |
| Users | Number of unique visitors. |
| Pageviews | Total number of pages viewed. |
| Bounce Rate | Percentage of visitors who leave after viewing one page. |
| Average Session Duration | Average time a user spends on your site. |
These metrics help understand your site’s performance and user engagement. Use this data to make informed decisions and improve your website.

Credit: www.rockethub.com
Hotjar
Hotjar is a powerful tool that helps track traffic and user analytics. It provides insights through various features that can enhance your website’s performance. This blog post will explore some of Hotjar’s key features, including Heatmaps, User Recordings, and Conversion Funnels.
Heatmaps
Hotjar’s Heatmaps display user interactions on your website. They show where users click, move, and scroll. This visual representation helps identify popular and ignored areas on your site.
Key Benefits of Heatmaps:
- Understand user behavior
- Identify hotspots and dead zones
- Optimize layout and design
User Recordings
User Recordings allow you to watch real-time user sessions. You can see how users navigate your site. This helps identify usability issues and potential pain points.
Advantages of User Recordings:
- Gain in-depth user insights
- Improve user experience
- Identify bugs and issues
Conversion Funnels
Hotjar’s Conversion Funnels track the steps users take to complete a goal. They show where users drop off in the process. This helps you understand and fix bottlenecks.
Benefits of Conversion Funnels:
- Increase conversion rates
- Identify and fix drop-off points
- Optimize user journey
Mixpanel
Mixpanel is a robust tool for tracking user interactions with your website. It goes beyond page views to provide in-depth insights. This tool helps businesses understand user behavior and improve engagement.
Event Tracking
Mixpanel’s Event Tracking feature records every interaction on your site. From button clicks to form submissions, you can track it all. This helps identify which actions drive conversions. You can also set up custom events tailored to your needs. Tracking user actions becomes simple and efficient.
User Segmentation
User Segmentation lets you categorize users based on behavior. Group users by demographics, device types, or actions taken. This helps target specific user groups with personalized content. You can also analyze how different segments interact with your site. This feature ensures your marketing efforts are more effective.
Retention Analysis
Mixpanel’s Retention Analysis feature helps you understand user retention. Track how many users return after their first visit. This insight is vital for improving user experience. You can see which features keep users coming back. Improving retention rates becomes easier with this data.
| Feature | Description |
|---|---|
| Event Tracking | Tracks every interaction on your website. |
| User Segmentation | Groups users based on different criteria. |
| Retention Analysis | Analyzes user return rates over time. |

Credit: blog.hubspot.com
Crazy Egg
Crazy Egg is a powerful tool for tracking website traffic and user behavior. It’s easy to use and provides valuable insights. Crazy Egg helps you understand what users do on your site.
Snapshots
Crazy Egg’s Snapshots feature offers a visual representation of user interaction. It captures click data on your website. This helps you see which areas get the most attention.
Snapshots can show:
- Hotspots where users click the most
- Areas that are ignored
- Clicks on buttons and links
Use this data to improve your website’s layout and navigation.
Scroll Maps
Scroll Maps in Crazy Egg show how far users scroll down a page. This is crucial for understanding content engagement. You can see if users reach the end of your content or drop off early.
Scroll Maps provide insights like:
- Where users lose interest
- Which sections hold user attention
- Optimal places for calls-to-action
With this data, you can adjust your content placement for better engagement.
A/b Testing
Crazy Egg’s A/B Testing feature lets you compare different versions of a page. It helps you determine which version performs better. This is essential for optimizing conversion rates and user experience.
Steps for A/B Testing:
- Create two versions of a page
- Send equal traffic to both versions
- Analyze the performance data
- Implement the better performing version
A/B Testing can reveal:
- Better headlines
- Effective images
- Optimal layout and design
Using A/B Testing, you can make data-driven decisions to improve your site.
Matomo
Matomo is a powerful web analytics tool. It offers a wide range of features. This tool helps track traffic and user behavior effectively. Let’s explore its key features.
Privacy Features
Matomo places a high priority on user privacy. It ensures all data stays on your servers. This means no third-party access to sensitive information.
Here are some key privacy features:
- GDPR compliance
- Data anonymization
- Customizable consent forms
Using Matomo, you can respect users’ privacy and stay compliant with laws.
Integration Options
Matomo offers flexible integration options. You can easily connect it with various platforms. This makes it convenient to gather comprehensive data.
Here are some popular integration options:
- WordPress
- Google Analytics
- E-commerce platforms
These integrations help streamline your analytics processes.
Customizable Dashboards
Matomo features highly customizable dashboards. You can tailor them to meet your unique needs. This ensures you see the most relevant data at a glance.
Key benefits of customizable dashboards include:
- Drag-and-drop interface
- Wide variety of widgets
- Real-time updates
With Matomo, you get a clear and personalized view of your data.
Clicky
Clicky is a powerful tool for tracking traffic and user analytics. It offers real-time data, heatmaps, and uptime monitoring. These features help you understand user behavior and website performance.
Real-time Analytics
Clicky provides real-time analytics to monitor your website traffic instantly. You can see how many users are on your site at any moment. This feature shows detailed user actions, such as clicks and page views. It also tracks conversions, helping you measure the success of your campaigns.
Real-time data is crucial for quick decision-making. You can identify trends and respond promptly. Clicky’s dashboard is user-friendly and customizable. You can view the metrics that matter most to you.
Heatmaps
Clicky’s heatmaps offer visual insights into user interactions. Heatmaps show where users click, scroll, and hover on your website. This helps you understand which areas attract the most attention.
Using heatmaps, you can optimize your site layout. Place important content where users engage the most. Clicky’s heatmaps are easy to generate and interpret. They provide a clear picture of user behavior.
| Feature | Description |
|---|---|
| Click Tracking | Shows where users click on the page |
| Scroll Depth | Measures how far users scroll down the page |
| Hover Maps | Indicates where users hover their mouse |
Uptime Monitoring
Clicky’s uptime monitoring ensures your website is always accessible. It checks your site’s status regularly. You receive alerts if your site goes down. This helps you fix issues quickly.
Uptime monitoring also tracks the performance of your website. It logs response times and downtime events. This data helps you improve your site’s reliability. Clicky provides detailed reports on uptime and performance.
- Real-time alerts for downtime
- Detailed uptime reports
- Performance tracking for better reliability
Clicky’s features are designed to enhance your understanding of user behavior. With real-time analytics, heatmaps, and uptime monitoring, you can make informed decisions to improve your website.
Choosing The Right Tool
Tracking traffic and user analytics is crucial for any website. The right tool helps you understand your audience, optimize your content, and boost your site performance. But how do you choose the right tool?
Business Needs
First, consider your business needs. Do you need detailed analytics or just basic stats? For an e-commerce site, you need to track conversions and sales. A blog might focus more on audience engagement and page views.
- Identify key metrics you want to track.
- Consider your industry and specific goals.
- Think about integration with existing tools.
Aligning the tool with your needs ensures you get useful insights.
Budget Considerations
Next, think about your budget. There are free tools like Google Analytics. But paid options offer advanced features. Create a budget plan to understand what you can afford.
| Tool | Cost | Features |
|---|---|---|
| Google Analytics | Free | Basic tracking, audience insights |
| SEMrush | Paid | Advanced SEO, competitive analysis |
| Hotjar | Free/Paid | Heatmaps, user recordings |
Select a tool that fits within your budget while meeting your needs.
Ease Of Use
The tool’s ease of use is essential. A user-friendly interface saves time and effort. Look for tools with intuitive dashboards and easy navigation.
- Check user reviews and ratings.
- Try free trials to test the interface.
- Ensure the tool offers good customer support.
Ease of use can significantly impact your productivity and the accuracy of your data analysis.
Choosing the right tool involves evaluating your business needs, budget, and ease of use. This ensures you select a tool that enhances your website’s performance and provides valuable insights.
Future Trends
The landscape of tracking traffic and user analytics is evolving rapidly. New technologies are emerging to provide deeper insights and more accurate data. The future holds exciting possibilities for tools that track and analyze user behavior.
Ai And Machine Learning
AI and Machine Learning are revolutionizing user analytics. These technologies help to predict user behavior. They also personalize user experiences in real-time.
Benefits of AI and Machine Learning in user analytics:
- Predictive analytics for better decision-making
- Enhanced personalization for users
- Automated data analysis for efficiency
AI tools can identify trends and patterns that humans might miss. This allows businesses to stay ahead of the curve and adapt quickly.
Data Privacy Concerns
With growing data privacy concerns, businesses must be cautious. User data must be handled with care and transparency.
Key data privacy trends include:
| Trend | Impact |
|---|---|
| GDPR Compliance | Strict data handling regulations |
| Data Anonymization | Protects user identities |
| User Consent | Users must opt-in for data collection |
Businesses should invest in tools that prioritize user privacy. This builds trust and ensures compliance with laws.
Integration With Other Tools
Future analytics tools will need seamless integration with other platforms. This ensures a holistic view of user behavior across channels.
Important integrations include:
- CRM systems for customer relationship management
- Marketing automation tools for campaign management
- Social media platforms for tracking engagement
Integrated tools offer a unified data ecosystem. This simplifies data collection and analysis, making it more efficient.
Frequently Asked Questions
What Are The Best Tools For Traffic Analytics?
Google Analytics and SEMrush are top tools for tracking website traffic. They offer detailed insights into user behavior, traffic sources, and more. These tools can help you optimize your website and improve performance.
How Can I Track User Behavior On My Site?
You can track user behavior using tools like Hotjar and Crazy Egg. They offer heatmaps, session recordings, and user feedback. These insights help you understand how users interact with your site.
Why Use User Analytics Tools?
User analytics tools provide valuable insights into how visitors use your site. They help you identify areas for improvement. This can lead to better user experience and higher conversion rates.
Can Google Analytics Track Mobile Traffic?
Yes, Google Analytics can track mobile traffic. It provides detailed reports on mobile user behavior. This helps you optimize your site for mobile users.
Conclusion
Tracking traffic and user analytics is essential for website growth. Utilize these tools to gain actionable insights. Understanding user behavior helps optimize content and improve user experience. Stay ahead in the digital landscape by regularly monitoring your analytics. Make data-driven decisions to achieve your website’s goals and enhance online presence.
